
Keep Up with Addis Insight
Add us to your Google Preferred Sources to see updates first.
By-Asfaw Gedamu xsv
Introduction
In June 2026, Dereje Engida (PhD), president of Addis Ababa Science and Technology University (AASTU), offered a tidy explanation for the collapse of Ethiopia’s Grade 12 national exam pass rate. Speaking to The Reporter, he said:[1]
“The fundamental reason is cheating… When students take the exams on university campuses, there is no opportunity to cheat. The only way to pass is through hard work, and unfortunately, very few students prepare themselves adequately… The students passing the national exams and joining universities today are those who can take and pass the exams on their own merit.”
It is a comforting story, and it is not entirely wrong , cheating was real, and campus-based invigilation might have curbed it. But it is dangerously incomplete. It is what statisticians call a reductionist attribution error: it treats the removal of one confound (cheating) as proof that the remaining variance in scores reflects merit alone, when in fact it may simply reveal a second, larger puzzle , the radical inequality of the classrooms students come from. An exam can only measure ability fairly if the conditions producing that ability are roughly equal. In Ethiopia today, they are not remotely equal, and the data below shows why treating a 91-percent failure rate as a triumph of integrity is, at best, premature.
1. The Grade 12 Exam, By the Numbers
Public commentary on this crisis has repeatedly cited Grade 12 pass-rate figures without specifying which cutoff or which cohort a given percentage describes, and that imprecision undermines the credibility of any policy critique built on the numbers.
The Grade 12 Higher Education Entrance Examination determines university admission. In the 2024/25 cycle, 585,882 students sat the exam; 48,929 (8.4%) scored the 50% pass mark. The Ministry later lowered the cutoff to 49.5%, lifting the pass rate to 8.9% and admitting roughly 3,350 additional students.
Treating the original 8.4% figure and the subsequently adjusted 8.9% figure as interchangeable, without noting that the shift reflects a lowered bar rather than an improvement in preparedness, is not a rounding error , it is the kind of imprecision that lets officials and critics alike talk past each other with mismatched numbers. Any serious policy article, and any Ministry response to it, has to be precise about exactly which cutoff and which cohort a given percentage describes, even while recognizing that the underlying disease remains the same: a K–12 system that is not preparing students for the standard imposed on them at the finish line.
2. The “Pure Merit” Fallacy, By the Numbers
If Dr. Dereje’s logic holds, that campus invigilation isolates raw ability , pass rates should be roughly uniform across school types, since honesty and diligence are not distributed by school fee schedule. They are not uniform. They track wealth almost perfectly.
| School Type | Approx. Enrolment Share | 2024/25 Pass Rate | Typical Conditions |
| Government boarding / science schools | <5% | ~87% | State-funded, reliable power & internet, supervised study, low pupil–teacher ratios |
| International / community schools | Elite & diaspora | ~86% | Premium salaries, international curricula, well-equipped labs |
| Urban private day schools | Middle class | ~51% | Fee-funded, insulated from public budget cuts |
| Standard government schools | ~90% of candidates | 5–9% | Pupil–teacher ratios often above 60:1, chronic textbook and lab shortages |
Sources: Ministry of Education results as reported by Ethiopian Monitor, Borkena, Birr Metrics and Addis Insight, September–October 2025.
The unfair advantage does not end at secondary school. Under Addis Ababa University’s new entrance-exam admissions policy, self-sponsoring students are free to choose whichever field of study they wish to join outright. Non-self-sponsoring, scholarship-track students, by contrast, are placed into a shared first year of mostly common coursework and must then compete on that first-year performance to be admitted into their preferred field. A wealthier, self-sponsoring student who can afford to pay their own way starts university with a choice already in hand, the very choice a lower-income, scholarship-track student can only earn after a year of unrelated competition.
The historical trend makes the same point on a longer timescale. Pass rates were a stable ~50–55% for a decade before the 2022 crackdown, then fell off a cliff , far faster and further than a mere reduction in cheating should produce if the underlying teaching and learning had been sound all along.
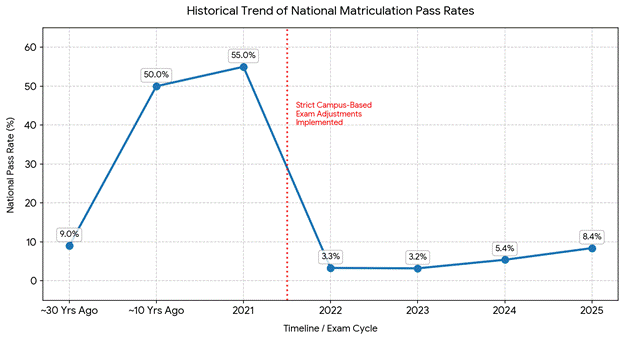
Figure 1Sources: JSSDR (2025); Borkena; Ethiopian Monitor.
Subject-level data sharpens the point further: the share of Natural Science students scoring above 50% fell from 81% in 2010/11 to about 11% in the most recent cycle, and Social Science pass rates fell from 48% to roughly 5%[3]. An 81-point collapse in one generation cannot be explained by the sudden disappearance of cheat sheets. It tracks the physical and pedagogical decay of secondary science and humanities teaching , a decay that predates, and will outlast, exam-room security measures.
3. A Teaching Corps the System Never Equipped
If students are being asked to demonstrate mastery, it is worth asking whether their teachers can. The evidence says, overwhelmingly, no.
- Roughly one in four teachers passes the Ministry’s own subject-proficiency competency exam , meaning about three in four active teachers have not demonstrated mastery of the subject they are assigned to teach.[4]
- In Oromia specifically, the regional education bureau head reported that only 23% of teachers passed their subject competence exam.[5]
- By the Ministry’s own review, roughly 89% of Ethiopian schools fall below the minimum operating standard the Ministry itself has set , and only four out of some 47,000 primary and secondary schools met the established standard in a recent assessment.[6]
- Teacher training reform has often meant a single 2–3 day rushed workshop to introduce an entirely new curriculum framework, rather than sustained professional development.[7]
None of this is a character indictment of Ethiopia’s teachers, most of whom are themselves products of the same under-resourced pipeline. It is evidence that the system is asking educators to deliver outcomes it has not equipped them to deliver and then measuring their students against that unmet standard.
4. Starving the Pipeline While Demanding Excellence
The fiscal picture explains why. Ethiopia’s education budget looks larger every year in nominal birr terms, but its real purchasing power has been falling for five consecutive years.
In 2020/21, education spending equalled roughly 24% of total government expenditure and about 4.5% of GDP , above the global “Education for All” benchmark of 20% of public spending. By 2021/22 that had fallen to about 23% of spending and 4.07% of GDP; by 2022, to 3.74% of GDP. For the 2025/26 fiscal year, education received roughly 240 billion birr , under 10% of total federal expenditure[8]. A 2024/25 UNICEF review found the education budget’s nominal 18.8% increase translated into a real increase of just 1.3% once inflation was accounted for, and that real education spending has fallen by roughly one-third since 2020/21[8]. Currency devaluation and debt servicing have eaten the difference.
This macroeconomic squeeze is not abstract at the classroom level. University leaders have said so publicly and on the record:
“The fee allocated per student, per day for feeding, is only 22 birr.” , Lemi Guta (PhD), President, Adama Science & Technology University [9]
Kotebe University of Education, led by Berhanemesqel Tena (PhD), has been left operating 50 unrenovated classrooms out of a budget of 446 million birr that inflation has substantially eroded, while the Ministry of Finance has told Parliament that new brick-and-mortar university construction is, for now, off the table entirely.[9] Meanwhile, the sector overall received 79.8 billion birr in one recent federal allocation , 8.22% of the federal budget, the fifth-highest of twenty sectors, but a figure dwarfed by the scale of the shortfall it is meant to cover.[9]
It is difficult to reconcile a national policy of tightening exam security with a national policy of shrinking the real resources available to the classrooms that exam is supposed to certify.
5. A Curriculum Rewritten Faster Than It Could Be Taught
A peer-reviewed study in the Journal of Social Sciences and Development Research (2025) statistically links the 2021 rollout of Ethiopia’s new competency-based curriculum to the exam collapse, finding a strong negative correlation (r = –0.82, p < 0.05) between years of exposure to the new curriculum and pass rates[10]
- Only 18% of surveyed students felt the new curriculum prepared them for the exam; 62% rated its material as unclear or irrelevant.[10]
- About 68% of students reported a mismatch between what the curriculum taught and what the exam actually tested , a direct violation of basic assessment-validity principles.[10]
- Textbooks were rushed into print with factual errors and missing prerequisite content , calculus limits and organic chemistry among them.[10]
- 70% of surveyed teachers said they received only a single 2–3-day training session to implement the entire new framework.[10]
Curriculum overhaul is not a bad idea , competency-based learning is standard international practice. But the study’s finding is that Ethiopia changed what students were taught faster than it could retrain the teachers, rewrite the textbooks, or align the exam , and then held students accountable to the old exam standard anyway.
6. The Absentee Crisis: Conflict, Displacement, and the Missing Students
Official commentary has tended to describe students who never sit the exam as simply unprepared and encouraged to try again next year. That framing does not survive contact with Ethiopia’s displacement data.
As of 2024, the International Organization for Migration’s Displacement Tracking Matrix identified roughly 3.3 million internally displaced people in Ethiopia, 69% displaced by conflict[11]. Conflict alone accounts for an estimated 70% of the country’s out-of-school children and youth. In 2023 and 2024, the UN verified 32 separate attacks on schools, alongside repeated instances of schools being occupied by armed actors[12]. Earthquakes in late 2024 and early 2025 damaged 50 schools and disrupted education for nearly 7,000 children; drought-driven closures in the Somali and Afar regions affected thousands more[12].
When a family has fled fighting in Amhara, Oromia, or Tigray, the logistical and psychological demands of travelling to a secure, university-hosted exam centre are not a matter of “preparing better next time.” They lack documentation frequently lost in flight, the funds for transit, and, in many cases, physically safe passage. Framing their absence as a personal failing erases a humanitarian crisis and re-brands it as a motivation problem.
7. The Ministry’s Own Retreat , and What It Reveals
The strongest evidence against the “pure merit” narrative may be the Ministry of Education’s own behavior. In December 2025, after roughly 92% of a prior cohort failed, a public petition led by education advocates collected 3,500 signatures calling for an emergency, temporary lowering of the pass mark. Its organizers met directly with Education Minister Berhanu Nega (Prof) and his advisor.
Weeks after announcing the 8.4% result for 2024/25, the Ministry quietly lowered the qualifying score from 300 to 295 points , a 49.5% effective threshold , admitting roughly 3,350 additional students and lifting the official pass rate to 8.9%[13]. This was framed administratively as a technical adjustment, but substantively it was an acknowledgment that the original bar, applied to the system as it currently exists, was producing an outcome the state itself judged unsustainable.
The remedial program , an extra year of study before re-sitting the exam , is the Ministry’s preferred structural answer for the hundreds of thousands who fail. Students and advocates report that remedial materials frequently do not match what the exam actually tests, that families already stretched thin cannot afford an additional year, and that instruction quality in remedial streams is often treated as a lower priority by the universities hosting it.[14] A pathway this porous cannot be the sole safety net for a system failing 9 in 10 candidates.
The social costs of leaving that gap unaddressed are already visible. Outward migration along the Eastern Route from Ethiopia to Yemen rose 34% in a recent year-on-year comparison, with 98% of migrants citing economic reasons for leaving , a plausible downstream effect of hundreds of thousands of young people finding no academic or vocational pathway forward.[15] Violent unrest connected to exam outcomes, including a fatal incident at Debre Tabor University and a walkout by more than 12,000 students in Amhara, is a warning sign, not an isolated event.[15]
8. How Ethiopia Compares
Regional context matters for calibrating how serious this is. Ethiopia’s own university-entry pass rate of single digits stands apart even among struggling education systems: South Africa’s Bachelor-level entry rate is roughly 41%; Kenya’s university-qualifying rate is about one in four candidates; Tanzania passes over 90% overall but hides a persistent ~19% math pass rate; Nigeria’s 2025 grading-error recount moved its pass rate from 38% to 63% overnight, showing how fragile exam-data credibility can be everywhere.[16] Among comparable countries, only Liberia’s roughly 1.6% credit-pass rate approaches Ethiopia’s collapse. This is not “growing pains” common to developing education systems , it is an outlier crisis.
9. A Policy Roadmap: Seven Structural Reforms
Ending a policy of exam-room enforcement without a matching policy of classroom investment simply documents collapse with greater precision. The following measures target root causes rather than the point of final measurement.
I. Replace the single-exam gate with a Composite Matriculation Matrix
Weight University entrance 40% on continuous, moderated regional assessment across Grades 10–12 and 60% on the national terminal exam. This reduces the outsized influence of a single high-stress sitting and rewards sustained engagement over three years, not one morning.
France already runs a close version of this at national scale. Since its 2021 baccalauréat reform, finalized by a December 2023 decree, 40% of the final grade comes from continuous assessment drawn from Première and Terminale report cards, with the remaining 60% from a small set of terminal exams and an oral defense , almost exactly the split proposed here.[17]
II. Institutionalize an Equity-Adjusted Merit Index (EAMI)
Weight admissions scores against a school’s documented infrastructure , pupil–teacher ratio, lab access, textbook availability. A 60% score from a school with a 65:1 ratio and no functioning laboratory reflects materially different latent capacity than an 85% score from a fully resourced academy, and admissions policy at flagship universities should say so explicitly.
This is not untested. Texas’s Top Ten Percent law, which has guaranteed Texas public university admission to top decile graduates of any high school since 1997, was found in a 2024 NBER-published analysis to raise a qualifying student’s odds of enrolling at the state’s flagship universities by 13.8 percentage points; the students it pulled in earned 0.71 points higher college GPAs on average and re-enrolled for a second year 16 percentage points more often than the students they displaced, most of them from high schools with far heavier concentrations of economically disadvantaged students.[18] Chile’s PACE program, which guarantees university access to top-ranked graduates of partner schools serving disadvantaged communities regardless of their national exam score, shows the same pattern: an experimental evaluation found no elevated dropout among students the program induced to enrol in more selective institutions than their exam scores alone would have allowed.[19] Brazil’s 2012 quota law, which reserves half of federal university seats for public-school graduates with further sub-quotas by income and race, has produced a similar result at a much larger scale: most performance studies find no systematic gap in grades or completion between quota and non-quota students.[20] None of these systems eliminated the underlying inequality in secondary preparation; what they show is that adjusting the admissions bar for context does not, by itself, produce the academic collapse critics predict.
III. Launch an emergency, multi-year teacher rehabilitation program
Replace the 2–3 day training model with sustained, subject-specific professional development, paired mentorship between university faculty and secondary teachers, and a costed timeline for closing the competency-exam gap (from ~25% passing today toward a defined national target).
Brazil’s own Sobral municipality, in one of the country’s poorest states, faced Ethiopia’s exact diagnosis in 2000: 48% of its second-graders could not read. Instead of tightening exam security, it restructured how teachers were supported , scripted, sequenced lesson plans; formative assessments given twice yearly and used to redirect coaching immediately; and a dedicated pedagogical coach attached to every school, paired with real school-level autonomy in exchange for accountability for results. Sobral’s ranking on Brazil’s national learning index rose from 1,366th out of 5,570 municipalities in 2005 to 1st by 2017, and 84% of its third-graders now read proficiently against 55% nationally, with a comparable gap in math.[21]
IV. Set and enforce minimum operational standards before testing students against them
Legally mandate a maximum 40:1 pupil–teacher ratio and 1:1 textbook-to-student allocation in every public secondary school as a precondition for holding that school’s students to the national exam standard. No school should be judged against a bar its own Ministry admits it has not resourced.
India’s 2009 Right to Education Act took this exact approach: it made a 30:1 pupil–teacher ratio, functioning toilets, drinking water, and a library a legal precondition for a school’s recognition, not an aspiration contingent on future budgets. An academic evaluation of the law’s first decade found real, measurable gains in the specific indicators it mandated , but also found that those infrastructure gains did not translate cleanly into higher test scores, a reminder that fixing the classroom floor is necessary but not, on its own, sufficient.[22]
V. Build a conflict- and displacement-responsive exam infrastructure
Deploy mobile and satellite testing centers in secure regional hubs, waive documentation requirements for verified IDPs, and fund state-subsidized catch-up instruction for displaced youth before they are permanently locked out of the academic pipeline. Reinstate targeted affirmative-action support for girls and other structurally disadvantaged groups whose removal has measurably widened gaps.
Jordan offers a working template here. Camp-based schools inside Zaatari and Azraq administer the Tawjihi, Jordan’s own national exit exam, directly on-site, and roughly 5% of the Ministry of Education’s schools nationwide run double shifts so that Syrian refugee children can use existing buildings without displacing Jordanian students or waiting years for new construction; refugees sit the same exam on the same terms as citizens and can apply it toward university admission.[23] Colombia built something similar for its own internally displaced children: Escuela Nueva’s Círculos de Aprendizaje program delivers flexible, self-paced, multigrade instruction through trained tutors as a deliberate bridge back into formal schooling rather than a permanent holding pattern. The wider Escuela Nueva model it grew from was rigorous enough that a UNESCO regional assessment in the late 1990s found Colombia to be the only Latin American country where rural students outperformed urban ones , the exact reversal Ethiopia would need to engineer for its own displaced and rural populations.[24]
VI. Ring-fence real (inflation-adjusted) education spending
Commit, in law or binding fiscal framework, to restoring education’s share of GDP toward the 4.5%+ level last seen in 2020/21, with the commitment indexed to inflation rather than stated only in nominal birr , closing the gap between headline budget increases and the real resources reaching classrooms.
Ghana’s Education Trust Fund (GETFund), created in 2000, earmarks a fixed share of national consumption-tax revenue by law specifically for education, largely insulated from the year-to-year budget negotiation that Ethiopia’s own Ministry of Finance has cited as a constraint; it has funded several hundred infrastructure projects since, with construction and rehabilitation of academic buildings consistently its largest category of spending.[25] Brazil’s constitutionally mandated FUNDEB fund requires states and municipalities to pool a fifth of designated tax revenue for basic education and redistributes it by enrollment, with the federal government topping up the poorest states; that federal contribution was itself raised by constitutional amendment from 10% to a scheduled 23% this year, specifically to close the gap between rich and poor regions’ per-student spending.[26] The same Ceará state government behind Sobral’s turnaround went further still, rewriting the formula that distributes its share of state tax revenue to municipalities so that education outcomes, not population size, determine most of the discretionary allocation; the state capital, Fortaleza, cut its lower-secondary dropout rate from 30% to 0.6% within a decade of the change.[27]
VII. Publish disaggregated, transparent exam data by default
Require the Ministry and NEAEA/EAES to publish pass rates broken down by school type, region, gender, and displacement status alongside every result release, and to clearly distinguish the Grade 12 entrance exam from the university Exit Exam in all public communication. Opaque, aggregated reporting is what allows a single-cause narrative like “cheating” to substitute for structural diagnosis in the first place.
None of this would have been visible without transparency. Brazil’s national institute publishes its school-quality index at the level of every individual school and municipality, on a fixed biennial schedule , which is precisely what let researchers and rival state governments identify Sobral and Ceará’s results in the first place; Pernambuco, Alagoas, Espírito Santo, and Amapá have since copied Ceará’s financing formula after seeing its published rankings.[28] South Africa’s practice of publishing matric results broken down by its five-tier school poverty quintile has surfaced a gap a single national pass rate conceals entirely: a 2014 analysis that follows a Grade 8 cohort through to a Bachelor’s-level matric pass four years later found roughly 10% of students from the poorest quintile clearing that bar, against close to 39% from the wealthiest , a disparity invisible in the aggregate figure alone.[29]
Conclusion
Academic integrity is not the enemy here, and the crackdown on institutionalized cheating was a necessary, overdue correction. But integrity and equity are not the same achievement and celebrating a single-digit pass rate as proof of “pure merit” while teacher competency sits near 25%, real education spending keeps falling, 3.3 million people remain displaced, and a rushed curriculum was correlated with the very decline it was meant to reverse, is not vindication. It is a diagnosis the country has not yet acted on.
Ethiopia’s development ambitions , in AI, nuclear energy, advanced manufacturing, and the industries its own science universities are racing to build , cannot be carried by the roughly 3% of students insulated in boarding schools and international academies. They depend on whether the other 90%, sitting in classrooms with 60 students to a teacher and no lab functioning, are given a fair chance to prove what they know. Securing the exam room was the easy part. Rebuilding the pipeline that leads to it is the work still ahead.
References
[1] The Reporter Ethiopia, “‘Fundamentally Different’: AASTU President on Higher Learning, Industry 4.0,” interview by Ashenafi Endale, June 27, 2026. thereporterethiopia.com/51514/
[2] Ethiopian Monitor, “Grade 12 Exam Results: 8.4% of the Students Get Passing Mark,” Sept. 14, 2025; “Grade 12 Exams: MoE Brings Passing Mark Down Slightly,” Oct. 2, 2025.
[3] Journal of Social Sciences and Development Research (JSSDR), Vol. 2, No. 2 (2025), “Analyzing the Decline in Ethiopian National Examination Pass Rates.” stslpress.org
[4] Addis Standard, “In-depth: Is Ethiopia’s Education System Under a Serious Threat?” Oct. 19, 2023.
[5] Addis Insight, “2.3 Million Failed Before, Half a Million Failed This Year,” Dec. 9, 2025 (citing Dr. Tola Bariso, Oromia Education Bureau).
[6] allAfrica.com / Addis Standard, “Who Bears Blame for Consecutive Low National Exam Pass Rates in Ethiopia?” Sept. 25, 2025.
[7] JSSDR (2025), teacher-training findings.
[8] Addis Standard, “Ethiopia Risks Human Capital Crisis Amid ‘Early Skill Gaps’: New World Bank Report Warns,” May 29, 2026; UNICEF Ethiopia, National Education Budget Briefs, 2023/24 and 2024/25.
[9] Addis Fortune, “Higher Education Under Budget Squeeze, Infrastructure Woes During Reform Push.” addisfortune.news
[10] JSSDR (2025), curriculum-correlation findings (r = –0.82).
[11] IOM Displacement Tracking Matrix, National Displacement Report, 2024–26 rounds. dtm.iom.int/ethiopia
[12] Geneva Global Hub for Education in Emergencies, “Country Brief: Ethiopia’s Education Crisis,” March 2026. eiehub.org
[13] Ethiopian Monitor, “Grade 12 Exams: MoE Brings Passing Mark Down Slightly,” Oct. 2, 2025.
[14] Addis Insight, “2.3 Million Failed Before, Half a Million Failed This Year,” Dec. 9, 2025.
[15] allAfrica.com / Addis Standard, “Who Bears Blame…,” Sept. 25, 2025 (IOM Eastern Route migration data; Debre Tabor and Amhara walkout reporting).
[16] Addis Insight, “Why Ethiopia Has Africa’s Lowest National Exam Pass Rate,” Sept. 16, 2025 (regional comparative data).
[17] Ministère de l’Éducation nationale et de la Jeunesse (France), baccalauréat continuous-assessment rules confirmed by décret no. 2023-1206 of Dec. 26, 2023; as summarized by Les Cours du Parnasse and digiSchool, 2025–26.
[18] National Bureau of Economic Research, “Effects of Texas’ Top Ten Percent College Admissions Plan,” NBER Digest, Aug. 2024, summarizing A. Kapor, “Transparency and Percent Plans,” NBER Working Paper 32372.
[19] Institute for Fiscal Studies (UK), “The Impacts of Preferential College Admissions for the Disadvantaged: Experimental Evidence from the PACE Programme in Chile,” Working Paper WP202219.
[20] Brazilian Federal Law No. 12,711/2012 (“Lei de Cotas”); see also Wikipedia, “Quota Law,” summarizing comparative performance studies of quota and non-quota university students.
[21] World Bank, “Achieving World-Class Education in Adverse Socioeconomic Conditions: The Case of Sobral in Brazil,” 2020; World Bank Blogs, “How a City in Brazil Led Teachers to Get Every Child Reading by Grade 2,” 2024.
[22] Shah, M. and Steinberg, B., “India’s Right to Education Act: Trends in Enrollment, Test Scores, and School Quality,” CEPR VoxEU column, 2019.
[23] UNESCO, “Paving Pathways for Refugee Inclusion: Jordan Case Study,” 2024.
[24] HundrED, “Transforming a Nation: How a Colombian Learning Model Connected Vulnerable Children to Education,” 2023; Education Week, “Colombia’s Escuela Nueva Model Could Work in California,” 2015.
[25] “Financing Higher Education through Value Added Tax: A Review of the Contribution of Ghana Education Trust Fund (GETFund) in Fulfillment of Act 581,” 2009; Ghana Education Trust Fund Act, 2000 (Act 581).
[26] World Bank, “A Recipe for a More Equitable and Efficient Learning System,” 2020, on the 2020 FUNDEB constitutional amendment.
[27] World Bank Blogs, “In Ceará, Brazil, Mayors Have to Improve Education Outcomes to Receive More Funds,” 2024; Ceará State Law 14.023/2007.
[28] World Bank, “The State of Ceará in Brazil is a Role Model for Reducing Learning Poverty,” 2020, on subsequent adoption of similar ICMS mechanisms by Pernambuco, Alagoas, Espírito Santo, and Amapá.
[29] Spaull, N., “Education in SA , Still Separate and Unequal,” nicspaull.com, 2014, based on Department of Basic Education matric and Grade 8 enrollment data.

